AP_CandlePatterns_V2Created by : Andrew Palladino
Date: 1/29/2017
This indicator displays a message above/below a bar when certain candle patterns appear. The indicator currently supports two candle patterns.
Consecutive Up/Down Bars:
The indicator searches for instances where there are more than n number of consecutive up bars or down bars on a given time frame. For example, the user can specify the minimum number of consecutive up/down bars, default is set to 8. When the number of consecutive up/down bars is greater or equal to 8, a label will be displayed above the high, for up bars, and below the low for down bars. The color of the next candle will turn red when the criteria is met.
Bearish/Bullish Pin Bar Reversal Signals:
The indicator will alert the trader when there is a Pin bar formation on the current time frame.
The Pin bar trend period is currently set to 20 bars, which translates to the following:
In an uptrend, the high of the Pin bar must be the highest of the last 20 bars.
In a downtrend, the low of the Pin bar must be the lowest of the last 20 bars. The trend bar period acts as a filter which ignores any pin bar formation during a trend continuation move. A trend continuation move is subjective and must be quantified by the user by setting the trend period value accordingly.
The trader has the ability to enable or disable individual candle formations.
Additional patterns will be added in the future.
Search in scripts for "Up down"
UltraTrendsFuschia is pivot down, yellow is pivot up, up is confirmed up, down is confirmed down, green is uptrend, red is downtrend, gray is no trend.
I recommend pairing this with:

SCOTTGO - Buy Sell Volume📊 SCOTTGO - Buy Sell Volume Bars - Delta - Up Down Volume Bars
This indicator disaggregates the total volume traded on each bar into estimated Buying Volume and Selling Volume to visualize market pressure and dominance directly in a dedicated sub-pane.
Key Features:
Volume Disaggregation: Uses a standard formula to estimate how much of a bar's total volume was associated with upward (buying) pressure and how much was associated with downward (selling) pressure.
Visual Clarity: Plots the Buy Volume (teal, upward) and Sell Volume (red, downward) as separate columns against a transparent total volume background, allowing for quick assessment of pressure balance.
Real-Time Badge: A dynamic badge is fixed to the corner of the chart (default: Top Right) providing a numeric summary of the latest bar:
Buy %: Percentage of the bar's total volume estimated as Buying Volume.
Sell %: Percentage of the bar's total volume estimated as Selling Volume.
Delta %: The magnitude of the volume difference (Delta) as a percentage of total volume, indicating the strength of the dominant side.
Dominance Indicator: The background color of the badge changes dynamically to immediately signal whether Buying (customizable color, default: Teal) or Selling (customizable color, default: Red) pressure was dominant on the current bar.
Usage:
Traders can use this tool to identify periods of heavy accumulation (high Buy Volume) or distribution (high Sell Volume), providing insight into the conviction behind price movements.

Smart Money Swing Strategy [All-in-One]# Pro Swing Trader 📈
A comprehensive swing trading indicator for TradingView that combines multiple confluence factors to identify high-probability trade setups with built-in risk management.
## 🎯 Overview
This indicator is designed for swing traders who want to catch momentum pullbacks with precision entries. It filters trades using multiple timeframe analysis, RSI zones, volume confirmation, and EMA trends to deliver only the highest-confidence setups.
### Key Features
✅ **Multi-Timeframe Confluence** - Confirms trades with higher timeframe analysis (Daily, 4H, etc.)
✅ **Smart Entry Signals** - Detects pullback-to-EMA reclaim patterns
✅ **Automatic Risk Management** - Calculates stops, targets, and R-multiples
✅ **Dynamic Stop Loss** - ATR trailing stop + break-even automation
✅ **Real-Time HUD Dashboard** - Live confluence scoring and trade metrics
✅ **Comprehensive Alerts** - Entry, TP1, TP2, and stop-loss notifications
✅ **Visual Trade Levels** - Clear on-chart stop-loss and take-profit lines
---
## 📊 How It Works
### Signal Logic
The indicator identifies two types of signals:
**Base Signals** (Small triangles):
- Price pulls back between Fast EMA and Slow EMA
- RSI is in the swing zone (40-60 by default)
- Price reclaims the Fast EMA with momentum
- Optional: Volume spike confirmation
**High-Confidence Signals** (Large triangles):
- All base signal criteria met
- Higher timeframe confirms the trend direction
- HTF RSI and slope alignment
- These are your primary trade signals
### Entry Conditions
#### Long Entry (🟢 HC L)
1. Fast EMA > Slow EMA (uptrend)
2. Previous candle closed between the EMAs (pullback)
3. Current candle crosses above and closes above Fast EMA (reclaim)
4. RSI between 40-60 (swing zone)
5. **HTF Confirmation**: Daily/4H price above EMA50, RSI > 50, positive slope
6. Optional: Volume > 1.5x 20-bar average
#### Short Entry (🔻 HC S)
1. Fast EMA < Slow EMA (downtrend)
2. Previous candle closed between the EMAs (pullback)
3. Current candle crosses below and closes below Fast EMA (reclaim)
4. RSI between 40-60 (swing zone)
5. **HTF Confirmation**: Daily/4H price below EMA50, RSI < 50, negative slope
6. Optional: Volume > 1.5x 20-bar average
---
## 🎛️ Settings & Parameters
### Trend Parameters
- **Fast EMA**: Default 20 - Quick trend detection
- **Slow EMA**: Default 50 - Major trend filter
- **Swing Lookback**: Default 10 - Bars to find swing high/low for stops
### RSI Settings
- **RSI Length**: Default 14
- **RSI Min**: Default 40 - Lower bound of swing zone
- **RSI Max**: Default 60 - Upper bound of swing zone
### Risk Management
- **Final TP Risk-Reward (R)**: Default 2.0 - Main profit target multiplier
- **TP1 R Multiple**: Default 1.0 - Partial profit target
- **Use Break-even Stop**: Move stop to entry after 1R profit
- **ATR Trailing Stop**: Dynamic stop based on ATR(14) x 2.0
### Filters
- **Require Volume Spike**: Optional volume confirmation filter
- **Use Higher TF Confirmation**: Enable multi-timeframe analysis
- **Higher TF**: Default "D" (Daily) - Can use 240 (4H), W (Weekly), etc.
---
## 📈 Dashboard (HUD)
The top-center dashboard shows real-time confluence status:
| Column | Meaning |
|--------|---------|
| **Trend** | Current trend direction (UP/DOWN/Flat) |
| **HTF** | Higher timeframe alignment (Bull/Bear/Flat) |
| **RSI Zone** | Is RSI in swing zone? (YES/NO) |
| **Volume** | Volume spike detected? (YES/NO) |
| **Signal** | Active signal type (HC LONG/HC SHORT/None) |
| **R Risk** | Current profit in R-multiples |
| **Stop** | Current stop-loss level |
| **TP1** | Partial take-profit status |
| **TP2** | Final take-profit status |
| **Conf %** | Overall confluence score (0-100%) |
### Confidence Score Breakdown
- **20%** - Trend present (up or down)
- **30%** - HTF confirmation aligned (or 15% if HTF off)
- **20%** - RSI in swing zone
- **10%** - Volume spike
- **20%** - High-confidence signal triggered
**Scoring**:
- 🟢 70%+ = High probability setup
- 🟡 40-69% = Moderate setup
- 🔴 <40% = Low probability
---
## 🔔 Alert Setup
The indicator includes 8 alert conditions:
### Entry Alerts
- **HC LONG ENTRY** - High-confidence long signal triggered
- **HC SHORT ENTRY** - High-confidence short signal triggered
### Profit Target Alerts
- **LONG TP1 Reached** - Hit partial profit (1R by default)
- **LONG Final TP Reached** - Hit final target (2R by default)
- **SHORT TP1 Reached** - Hit partial profit
- **SHORT Final TP Reached** - Hit final target
### Stop Loss Alerts
- **LONG Stop/BE/Trail Level Hit** - Long position stopped out
- **SHORT Stop/BE/Trail Level Hit** - Short position stopped out
### How to Set Up Alerts
1. Click "Add Alert" on TradingView
2. Choose this indicator from the dropdown
3. Select desired alert condition
4. Set alert to trigger "Once Per Bar Close"
5. Customize notification method (popup/email/webhook)
---
## 📋 Trading Workflow
### 1. Wait for High-Confidence Signal
Look for the large **HC L** or **HC S** triangle on chart close.
### 2. Verify Confluence
Check the HUD dashboard:
- Confidence score should be 70%+
- HTF status should show alignment
- RSI Zone should be "YES"
### 3. Entry
Enter the trade at market or on next candle open.
### 4. Set Stop Loss
Use the **initial stop** shown in the HUD (red line on chart):
- **Longs**: Below the swing low (10-bar lookback)
- **Shorts**: Above the swing high (10-bar lookback)
### 5. Set Take Profits
- **TP1**: 1R (50% position close) - Yellow line
- **TP2**: 2R (remaining 50% close) - Green line
### 6. Manage the Trade
- Monitor the **R Risk** column to track profit
- Stop moves to break-even automatically after 1R (if enabled)
- ATR trailing stop engages dynamically (red line adjusts)
- Exit if price hits dynamic stop level
---
## 🎨 Visual Guide
### On-Chart Elements
**Triangles**:
- Small lime/red triangles = Base signals (lower confidence)
- Large lime/red triangles = High-confidence signals (trade these!)
**Lines**:
- 🟢 Green line = Fast EMA (20)
- 🟠 Orange line = Slow EMA (50)
- 🔴 Red line = Dynamic stop-loss level
- 🟡 Yellow line = TP1 level
- 🟢 Green line = TP2 (final target)
**HUD Colors**:
- 🟢 Green = Bullish/Active/Good
- 🔴 Red = Bearish/Inactive/Warning
- 🟡 Yellow = Neutral/Caution
- 🔵 Blue = Informational
- ⚫ Gray = Disabled/Off
---
## 💡 Strategy Tips
### Best Practices
1. **Only trade High-Confidence signals** - Ignore base signals unless very experienced
2. **Respect the HTF** - Don't fight the higher timeframe trend
3. **Use proper position sizing** - Risk 1-2% of account per trade
4. **Partial profits work** - Take 50% off at TP1, let rest run to TP2
5. **Let winners run** - Trailing stop helps capture extended moves
6. **Be patient** - Quality over quantity; wait for 70%+ confluence
### Optimal Timeframes
- **Primary Chart**: 1H, 4H, Daily (swing trading)
- **HTF Setting**: One level higher than your chart
- If trading 1H → Set HTF to 4H or D
- If trading 4H → Set HTF to D or W
- If trading Daily → Set HTF to W
### Market Conditions
**Best Performance**:
- Trending markets with healthy pullbacks
- Clear support/resistance zones
- Moderate volatility
**Avoid Trading**:
- Extremely choppy/sideways markets
- Major news events (unless experienced)
- Low confidence scores (<40%)
---
## ⚙️ Advanced Customization
### Aggressive Setup (More Signals)
```
Fast EMA: 12
Slow EMA: 26
RSI Min: 35
RSI Max: 65
Use HTF Confirmation: OFF
Require Volume Spike: OFF
```
### Conservative Setup (Fewer, Higher Quality)
```
Fast EMA: 20
Slow EMA: 50
RSI Min: 45
RSI Max: 55
Use HTF Confirmation: ON
Require Volume Spike: ON
Final TP R: 3.0
```
### Scalping Adaptation (Not Recommended)
```
Fast EMA: 9
Slow EMA: 21
Swing Lookback: 5
TP1 R: 0.5
Final TP R: 1.0
```
---
## ⚠️ Risk Disclaimer
**IMPORTANT**: This indicator is for educational and informational purposes only.
- Past performance does not guarantee future results
- No indicator is 100% accurate
- Always use proper risk management
- Never risk more than you can afford to lose
- Consider using a demo account first
- Seek professional financial advice if needed
Trading involves substantial risk of loss and is not suitable for all investors.
---
## 🔧 Troubleshooting
### "No signals appearing"
- Check if HTF confirmation is enabled but market isn't aligned
- Verify RSI zone isn't too restrictive
- Ensure volume spike isn't filtering out all setups
- Try adjusting EMA lengths for your asset
### "Too many false signals"
- Enable HTF confirmation
- Tighten RSI zone (e.g., 45-55)
- Enable volume spike requirement
- Only trade 70%+ confidence setups
### "Stops too tight/wide"
- Adjust Swing Lookback length
- Modify ATR multiplier for trailing stop
- Consider the asset's volatility
### "Alerts not working"
- Ensure alert is set to "Once Per Bar Close"
- Check indicator is added to the chart
- Verify TradingView notification settings
---
## 📚 Version History
**v1.0 (Current)**
- Initial release
- Multi-timeframe confluence system
- Dynamic risk management
- Real-time HUD dashboard
- Comprehensive alert system
- ATR trailing stops
- Break-even automation
---
## 🤝 Support & Feedback
If you find this indicator helpful:
- ⭐ Star the script on TradingView
- 💬 Share your results and feedback
- 🐛 Report bugs or suggest improvements
- 📖 Share with other traders
---
## 📖 Additional Resources
### Recommended Reading
- "The New Trading for a Living" by Dr. Alexander Elder
- "Swing Trading Using Multiple Timeframes" - Educational articles
- Risk management and position sizing guides
### Learn More About
- Multiple timeframe analysis
- EMA crossover strategies
- RSI divergence and zones
- ATR-based stops
- R-multiple profit management
---
## 📝 License
This indicator is provided as-is for personal trading use.
**Usage Rights**:
- ✅ Use for personal trading
- ✅ Modify for personal use
- ❌ Resell or redistribute
- ❌ Claim as original work
---
## 🎓 Quick Start Checklist
- Add indicator to TradingView chart
- Set your preferred timeframe (1H/4H/Daily)
- Configure HTF setting (one level higher)
- Review default parameters
- Set up entry alerts (HC LONG/SHORT)
- Set up TP and SL alerts
- Test on historical data
- Paper trade first
- Start with small position sizes
- Track your results
---
**Happy Trading! 📊💰**
*Remember: Discipline, patience, and risk management are the keys to long-term success.*

Trend FilterTrend Filter
Summary
Trend Filter is a multi-factor trend-confidence indicator that produces a simple, actionable output: Direction (Up / Down / Ranging) and a normalized Confidence %. It is intended as a decision-support overlay to help traders quickly identify whether a market is trending or rangebound, and how strong that directional bias is.
What it shows
A single line in the on-chart table: Direction (Up / Down / Ranging).
A Confidence % (0–100) that combines multiple normalized market signals into a single score.
Optional notification row when a manually-selected reference timeframe does not match the chart timeframe.
Alert conditions when direction changes to Up, Down, or Ranging.
How the indicator works (concise, non-proprietary explanation)
Trend Filter computes a weighted confidence score from several complementary components, each normalized to a 0–100 scale and combined into a single confidence value. The components and their roles are:
EMA structure & spread (trend breadth)
-Uses three EMAs (fast / mid / slow) computed at lengths that scale with the selected/reference timeframe. The EMA spread (fast vs slow) quantifies directional separation.
HH/HL structure and streaks (price structure)
-Counts higher highs/higher lows (and the reverse) across a scaled lookback to measure whether price structure is predominantly bullish, bearish or mixed.
EMA slope (momentum of trend)
-A robust slope approximation (smoothed) measures whether the short EMA is rising/falling relative to its own smoothed history.
ADX / DMI (trend strength)
-Uses a standard ADX-style component to capture directional persistence and dampen the confidence score when the ADX is weak.
ATR (volatility context)
-ATR expressed as a percentage of price helps detect abnormal volatility regimes which affect the validity of trend signals.
Volume context
-Simple volume vs a short SMA gives a participation signal that increases confidence when moves occur with higher volume.
Each component is capped to avoid outsized influence. Components are scaled by a set of weights (configurable in code) and then combined. The final confidence is lightly smoothed before being used to determine direction and to feed alert conditions.
Important implementation & safety design choices (why it’s not a simple mashup)
Adaptive timeframe scaling: EMA lengths and lookbacks are proportionally scaled based on the chosen reference timeframe (Auto or manual). This preserves relative indicator behavior across 1-minute → Daily timeframes without manual retuning of each parameter.
HH/HL structure plus streaks: Instead of relying solely on moving averages or ADX, the script explicitly measures price structure (HH/HL counts and streaks) and blends that with slope/ADX. This reduces false trending signals on noisy price action.
Normalized, weighted combination with caps: Each component is normalized (0–100) and combined by predefined weights; cap thresholds prevent extreme component values from dominating the result. This is a design intended to produce interpretable confidence % rather than opaque binary outputs.
History and loop safety: The code enforces a cap and protects loop lengths against available historical bars to avoid runtime errors and to ensure the script remains stable on short data series.
Practical guardrails: The script includes notification behavior to highlight manual timeframe mismatches and avoids dynamic indexing patterns that can cause unreliable results on small bar histories.
These design decisions — adaptive scaling, structural HH/HL scoring, capped normalization and explicit safety limits — are the elements that distinguish Trend Filter from simple, single-indicator overlays (EMA-only, ADX-only, etc.) and form the basis for why closed-source protection is reasonable for commercial/invite-only publication.
User controls & recommended usage
Reference Timeframe: Auto (uses chart TF) or choose a manual reference TF (1min → D). When manual TF is selected, the table shows a mismatch warning if the chart TF differs.
Table placement & colors: Positioning and appearance of the on-chart table are configurable.
Confidence thresholds: The indicator uses internal thresholds to mark high/medium/low confidence. Users can interpret the Confidence % relative to those ranges.
Alerts: Built-in alerts fire only on direction changes (to Up, Down, or Ranging). Use alerts as a signal to review the chart rather than an instruction to trade automatically.
How traders typically use it
Add Trend Filter as an overlay to your chart.
Confirm that the recommended reference timeframe is appropriate (Auto will adjust automatically).
Use Direction and Confidence % together: high Confidence + Up (or Down) suggests staying with trend; Ranging suggests avoiding trend-following entries.
Combine this filter with your entry/exit rules (price structure, support/resistance, or your preferred signal generator).
Disclaimers & limitations
This is a decision-support indicator, not an automated execution strategy. It does not place orders and does not provide P/L or backtesting statistics.
Confidence % is an aggregated measure — treat it as context, not a guarantee.
Results vary across symbols and timeframes; use appropriate position sizing and risk controls.
The code intentionally includes history and loop safeguards; on very short histories the indicator may display conservative results.

SMI Trigger System - Lower - NPR21/ChatGPTSMI Trigger System (Lower) — Buy Low / Hrugu (Modified)
This indicator is a modified version of the original SMI Trigger System created by Buy Low, with later enhancements by Hrugu, published with permission.
The script is a lower-pane Smoothed Stochastic Momentum Index (SMI) designed to deliver clear, visually intuitive momentum signals without unnecessary clutter. This version focuses exclusively on SMI behavior and removes auxiliary indicators to keep signals clean, readable, and consistent across timeframes.
Key Features
Smoothed SMI line with dynamic color changes based on momentum direction
Raw SMI line for additional reference
Zero-line split cloud shading for quick bullish/bearish momentum identification
Upper and lower SMI reference levels for overbought/oversold context
Exact-bar SMI color-flip triangle markers for immediate visual confirmation
Adjustable triangle size and offset so markers do not overlap the SMI line
Fully customizable colors for:
Zero line
Smoothed SMI (up/down)
Raw SMI
Cloud above and below zero
Upper and lower SMI levels
How to Use
This indicator is designed to highlight momentum shifts, not to predict price. It works best when combined with price structure, trend context, or higher-timeframe bias.
1. SMI Line & Color Changes
The smoothed SMI line changes color based on momentum direction:
Up color → momentum strengthening
Down color → momentum weakening
A color change often signals a potential momentum shift.
2. SMI Color-Flip Triangles
Green ▲ triangle below the SMI
Appears when the smoothed SMI turns upward (bearish → bullish momentum).
Red ▼ triangle above the SMI
Appears when the smoothed SMI turns downward (bullish → bearish momentum).
Triangles are plotted on the same bar the SMI changes color and are offset so they do not overlap the SMI line.
These markers are intended as visual confirmations, not standalone trade signals.
3. Zero Line & Cloud
The zero line separates bullish and bearish momentum regimes.
Cloud above zero → bullish momentum bias
Cloud below zero → bearish momentum bias
Stronger signals often occur when SMI flips in the direction of the cloud.
4. Upper & Lower SMI Levels
Upper and lower reference levels help identify extended momentum.
Momentum flips near or beyond these levels may indicate:
Exhaustion
Potential pullbacks
Trend continuation setups when aligned with higher-timeframe direction
5. Best Practices
Use this indicator as a confirmation tool, not a prediction tool.
Combine with:
Market structure
Support and resistance
Trend direction
Volume or price action
Works well on tick charts, intraday timeframes, and higher-timeframe analysis.
Additional Notes
Triangles do not repaint
All visual elements are user-configurable
No ADX or Awesome Oscillator components
Designed for clarity, speed, and ease of interpretation
This script is intended for analytical and educational purposes only and does not constitute trading advice.

SMI Trigger System SMI Trigger System (Lower) — Buy Low / Hrugu (Modified)
This indicator is a modified version of the original SMI Trigger System created by Buy Low, with later enhancements by Hrugu, published with permission.
The script is a lower-pane Smoothed Stochastic Momentum Index (SMI) designed to deliver clear, visually intuitive momentum signals without unnecessary clutter. This version focuses exclusively on SMI behavior and removes auxiliary indicators to keep signals clean, readable, and consistent across timeframes.
Key Features
Smoothed SMI line with dynamic color changes based on momentum direction
Raw SMI line for additional reference
Zero-line split cloud shading for quick bullish/bearish momentum identification
Upper and lower SMI reference levels for overbought/oversold context
Exact-bar SMI color-flip triangle markers for immediate visual confirmation
Adjustable triangle size and offset so markers do not overlap the SMI line
Fully customizable colors for:
Zero line
Smoothed SMI (up/down)
Raw SMI
Cloud above and below zero
Upper and lower SMI levels
How to Use
This indicator is designed to highlight momentum shifts, not to predict price. It works best when combined with price structure, trend context, or higher-timeframe bias.
1. SMI Line & Color Changes
The smoothed SMI line changes color based on momentum direction:
Up color → momentum strengthening
Down color → momentum weakening
A color change often signals a potential momentum shift.
2. SMI Color-Flip Triangles
Green ▲ triangle below the SMI
Appears when the smoothed SMI turns upward (bearish → bullish momentum).
Red ▼ triangle above the SMI
Appears when the smoothed SMI turns downward (bullish → bearish momentum).
Triangles are plotted on the same bar the SMI changes color and are offset so they do not overlap the SMI line.
These markers are intended as visual confirmations, not standalone trade signals.
3. Zero Line & Cloud
The zero line separates bullish and bearish momentum regimes.
Cloud above zero → bullish momentum bias
Cloud below zero → bearish momentum bias
Stronger signals often occur when SMI flips in the direction of the cloud.
4. Upper & Lower SMI Levels
Upper and lower reference levels help identify extended momentum.
Momentum flips near or beyond these levels may indicate:
Exhaustion
Potential pullbacks
Trend continuation setups when aligned with higher-timeframe direction
5. Best Practices
Use this indicator as a confirmation tool, not a prediction tool.
Combine with:
Market structure
Support and resistance
Trend direction
Volume or price action
Works well on tick charts, intraday timeframes, and higher-timeframe analysis.
Additional Notes
Triangles do not repaint
All visual elements are user-configurable
No ADX or Awesome Oscillator components
Designed for clarity, speed, and ease of interpretation
This script is intended for analytical and educational purposes only and does not constitute trading advice.

MinsenTTS 2.0Minsen Trend Tracking System 2.0 (MinsenTTS 2.0)
明心鉴己 · 顺势而为
-------------------------------
“Minsen (明心道动)” 取自 “明心见性,道动为术”,是我作为一个独立交易者,对自己交易体系的一次完整梳理与输出。
交易做久了,我发现最难的不是技术,而是心性。所谓的 “明心”,不仅仅是看清行情,更是认清自己。是在面对市场的诱惑与恐慌时,能否诚实地执行自己制定好的原则,不侥幸、不自欺欺人。
MinsenTTS 2.0 就是基于这个初衷设计的辅助工具。我希望它能像一面镜子,客观地反映市场的真实状态,帮你在混沌中保持清醒,让你的每一次决策,都符合你内心的原则。
-------------------------------
我的设计理念
这套系统的核心,融合了我对“反者道动,弱者道用”的理解,旨在解决我们在交易中常遇到的三个难题:
1. 关于“明心”(去噪与自律):
市场里充满了噪音,很容易让人迷失。系统通过算法过滤掉了那些无效的波动,只呈现最核心的趋势。这不仅是为了看清盘面,更是为了让你在面对杂乱K线时,能守住自己的交易纪律,不被情绪左右。
2. 关于“顺势”(多维共振):
我们常说顺势,但什么是势?真正的趋势是动能、量能与结构的共鸣。这套系统不依赖单一信号,只有当市场的多个维度达成“共识”时,它才会确认趋势。顺势而为,才能让交易变得简单。
3. 关于“弱者道用”(柔弱与保全):
老子讲“柔弱胜刚强”。在交易中,承认自己的渺小,不与市场硬碰硬,才是长存之道。当行情极度亢奋、看似最强劲时,往往内部结构最为脆弱。系统内置的**“极值防御”**机制,就是帮你避开这种“盛极而衰”的锋芒。我们不争一时的暴利,而是求得资金在长周期里的安稳与复利。
-------------------------------
**特别说明:关于“诚实”与“不重绘”
既然讲“明心”,最基本的就是不自欺,也不欺人。
我特别反感市面上那种为了“好看”而作弊的指标。它们最恶心的地方在于:行情走完之后,回头在历史最高点补一个“卖出”,在最低点补一个“买入”。乍一看简直是神级预测,但在实盘的那个当下,信号根本不存在,你永远无法在那个位置成交。
MinsenTTS 2.0 严守底线,绝不使用未来函数,绝不重绘。 我们拒绝为了美化历史业绩而欺骗用户,更不会为了让指标看起来“神准”而扭曲数据的真实性。
所有的信号一旦在当前K线收盘确认,就永久固定,绝不会消失或漂移。哪怕是错误的信号,也会诚实地留在图表上。因为只有面对真实的(哪怕是不完美的)历史,我们才能进行有效的复盘,做出对自己负责的决策。
-------------------------------
Minsen 指标生态:左侧与右侧的配合
MinsenTTS 2.0 专注于右侧趋势追踪(趋势确立后的跟随)。为了获得更完整的视角,建议结合我的另一款指标 MinsenAMRS 使用:
* MinsenAMRS:负责左侧预警,在趋势反转前夕提供信号。
* MinsenTTS:负责右侧确认,在趋势确立后提供跟随依据。
心得分享:当 AMRS 提示反转风险,随后 TTS 确认趋势进入“萌芽期”或“发展期”,这种“左侧预警 + 右侧确认”的结合,往往能提供更高质量的观察窗口。
-------------------------------
图表元素解读:如何使用这套工具
为了还你一个清爽的盘面,系统将繁杂的数据处理转化为直观的视觉元素。以下是你默认可见的内容,建议按这个顺序来观察市场:
1. 🌊 智能趋势色带 (Smart Trend Band)
这是最直观的视觉参考,代表了市场阻力最小的方向。
颜色:绿色代表多头(上涨),红色代表空头(下跌)。
形态:色带越宽,说明趋势劲头越足;色带变窄,说明动能减弱。
衰竭提示:当色带边缘出现橙色轮廓,意味着趋势进入“衰竭期”。虽然价格可能还在惯性运行,但这提示你内部动能已经背离,这时候应该警惕风险,而不是盲目乐观。
(注:本系统采用国际主流配色:绿涨红跌)
2. 🏷️ 市场状态标记 (State Markers)
系统在关键节点会给出图标,作为你观察行情的窗口。
“多” / “空” 标签:代表市场状态发生了高胜率的切换(比如从震荡转为趋势)。这通常是趋势启动或重启的节点,值得你重点关注。
小三角图标 (△/▽):趋势延续标记。当趋势在发展中出现良性回调,并再次顺势突破时,系统会标记这个图标,提示趋势结构依然完整。
3. 🟨 横盘识别背景 (Consolidation Filter)
视觉表现:图表背景出现淡黄色区域。
含义:系统识别到市场进入了低波动或无序的横盘整理。
建议:在这片区域,趋势策略很容易失效。黄色的背景不仅是警示灯,更是资金的保护罩。它提醒你当前处于“垃圾时间”,避免在无序波动中反复磨损本金。
4. 📊 市场情报面板 (Info Table)
右下角的面板是对当前K线的全方位“体检”,帮你把感性的盘感量化为数据:
趋势 (Trend):强势/中等/弱势。注:此项仅代表动能的级别,不代表涨跌方向。
评分 (Score):0-100分。分数越高,代表动能、量能与结构的共振度越高。
阶段 (Stage):告诉你当前处于“萌芽、发展、加速”还是“衰竭”期。
置信度 (Confidence):算法对当前判断的把握有多大。
方向 (Direction):明确指出是“↗上涨”、“↘下跌”还是“震荡”。
市况 (State):定性判断是“趋势”还是“横盘”。
效率 (Efficiency):“高效”代表K线走得干脆利落;“低效”代表锯齿多、磨人。
5. 🚧 动态支撑与阻力 (Dynamic S/R Lines)
视觉表现:图表中延伸出的红色虚线与绿色虚线。
含义:这是系统自动筛选出的筹码密集区。红色虚线是潜在阻力,绿色虚线是潜在支撑。这些位置往往是价格可能停顿或测试的地方,做交易计划时可以作为客观参考。
-------------------------------
写在最后
工具是死的,人是活的。
MinsenTTS 2.0 只是一个辅助你观察市场的工具,它无法消除市场的不确定性,更不能替你做决定。
真正的交易决策,应该来自于你对自己交易系统的坚持,和对风险的敬畏。希望这个工具能帮你省去繁琐的计算,让你在看盘时,心里更明亮,决策更坚定。
明心鉴己,顺势而为。
-------------------------------
免责声明:本指标仅用于技术分析与市场观察,不构成任何具体的投资建议。金融市场风险巨大,请用户结合自身情况独立决策。
=========English Version=========
Minsen Trend Tracking System 2.0 (MinsenTTS)
Reflect on the Self · Flow with the Trend
-------------------------------
"Minsen" (明心道动) is derived from the philosophy of "Clarifying the Mind to see one's Nature, and acting through the movement of the Tao." It represents a complete consolidation and output of my personal trading system as an independent trader.
After trading for a long time, I realized that the hardest part is not the technique, but the mindset (psychology). "Clarifying the Mind" isn't just about seeing the market clearly; it's about seeing yourself clearly. It is about whether you can honestly execute your principles without luck-seeking or self-deception when facing the market's temptations and panic.
MinsenTTS 2.0 was designed as an auxiliary tool with this original intention. I hope it serves as a mirror, objectively reflecting the true state of the market, helping you stay clear-headed amidst the chaos, ensuring every decision aligns with your inner principles.
-------------------------------
My Design Philosophy
The core of this system integrates my understanding of "Reversal is the movement of the Tao; Weakness is the usage of the Tao." It aims to solve three common challenges we face in trading:
On "Clarifying the Mind" (De-noising & Discipline):
The market is full of noise that leads people astray. The system uses algorithms to filter out invalid fluctuations, presenting only the core trend. This is not just to see the chart clearly, but to help you maintain your trading discipline and remain unaffected by emotions when facing messy price action.
On "Flowing with the Trend" (Multi-dimensional Confluence):
We often talk about following the trend, but what is the "trend"? A true trend is the resonance of Momentum, Volume, and Structure. This system does not rely on a single signal; it only confirms a trend when multiple dimensions of the market reach a "consensus." Following the trend makes trading simple.
On "The Way of Weakness" (Yielding & Preservation):
Laozi said, "The soft and weak overcome the hard and strong." In trading, acknowledging one's insignificance and not fighting the market head-on is the way to survive. When the market is extremely euphoric and appears strongest, its internal structure is often the most fragile. The system's built-in "Extremes Defense" mechanism helps you avoid this "sharp edge" of exhaustion. We do not strive for momentary explosive profits, but seek the safety and compounding of capital over the long cycle.
-------------------------------
Special Note: On "Honesty" & "Non-Repainting"
Since we speak of "Clarifying the Mind," the most basic requirement is not to deceive oneself or others.
I have a strong aversion to indicators on the market that cheat just to "look good." The most disgusting part is how they operate: after the market moves, they go back and paint a "Sell" at the historical high and a "Buy" at the low. At first glance, it looks like a god-tier prediction, but in the reality of live trading, that signal did not exist, and you could never have executed that trade.
MinsenTTS 2.0 strictly holds the line: No Future Functions, No Repainting.
We refuse to deceive users to beautify historical performance, and we certainly will not distort the authenticity of the data just to make the indicator look "magical."
All signals are permanently fixed once the current candle closes. They will never vanish or drift. Even incorrect signals will honestly remain on the chart. Because only by facing real (even if imperfect) history can we conduct effective reviews and make responsible decisions.
-------------------------------
The Minsen Ecosystem: Left & Right Side Synergy
MinsenTTS 2.0 focuses on Right-side Trend Tracking (following after the trend is established). For a more complete perspective, it is recommended to combine it with my other indicator, MinsenAMRS:
MinsenAMRS: Responsible for Left-side Warning, providing signals on the eve of a trend reversal.
MinsenTTS: Responsible for Right-side Confirmation, providing the basis for following the trend after it is established.
Trader's Insight: When AMRS alerts to reversal risks, and subsequently TTS confirms the trend entering the "Germination" or "Development" stage, this combination of "Left-side Warning + Right-side Confirmation" often provides a higher-quality observation window.
-------------------------------
Chart Elements: How to Use This Tool
To return a clean chart to you, the system transforms complex data processing into intuitive visual elements. Here is the default content, and I suggest observing the market in this order:
1. 🌊 Smart Trend Band
This is the most intuitive visual reference, representing the path of least resistance.
Color: Green represents Bulls (Up), Red represents Bears (Down).
Shape: A wider band indicates strong momentum; a narrowing band indicates weakening momentum.
Exhaustion Alert: When an Orange Outline appears on the edge of the band, it means the trend has entered the "Exhaustion Phase." Although the price may still run on inertia, this warns you that internal momentum has diverged. You should be alert to risks rather than blindly optimistic.
(Note: This system uses the international color standard: Green for Up, Red for Down).
2. 🏷️ Market State Markers
The system provides icons at key nodes as windows for observing price action.
"Long" / "Short" Labels: Represent a high-probability switch in market state (e.g., from ranging to trending). These are usually the starting or restarting points of a trend and are worth your focus.
Small Triangle Icons (△/▽): Trend Continuation Markers. When a trend experiences a healthy pullback during development and breaks through again with the trend, the system marks this icon, suggesting the trend structure remains intact.
3. 🟨 Consolidation Filter (Range Background)
Visual: A pale yellow area appears in the chart background.
Meaning: The system has identified that the market has entered low-volatility or disordered sideways consolidation.
Advice: In this area, trend strategies are prone to failure. The yellow background is not just a warning light; it is a Capital Protection Shield. It reminds you that you are in "Junk Time"—avoid grinding down your principal in disordered fluctuations.
4. 📊 Market Info Table
The panel in the bottom right corner performs a comprehensive "Health Check" on the current candle, quantifying intuitive market feel into data:
Trend: Strong / Mid / Weak. Note: This represents the level of momentum, not the direction.
Score: 0-100. The higher the score, the higher the Confluence of momentum, volume, and structure.
Stage: Tells you if the trend is in "Germination," "Development," "Acceleration," or "Exhaustion."
Confidence: How confident the algorithm is in the current judgment.
Direction: Clearly indicates "↗ Up", "↘ Down", or "Range".
State: Qualitative judgment of "Trend" vs. "Consolidation".
Efficiency: "High" means the price action is clean and decisive; "Low" means it is choppy and grinding.
5. 🚧 Dynamic S/R Lines (Support & Resistance)
Visual: Red and Green dashed lines extending from the chart.
Meaning: These are dense volume zones automatically filtered by the system. Red dashed lines are potential Resistance; Green dashed lines are potential Support. These are locations where price is likely to pause or test, serving as objective references for your trading plan.
-------------------------------
Final Words
Tools are static; humans are dynamic.
MinsenTTS 2.0 is merely a tool to assist your market observation. It cannot eliminate market uncertainty, nor can it make decisions for you.
True trading decisions should come from your adherence to your own trading system and your reverence for risk. I hope this tool saves you from tedious calculations, making your mind clearer and your decisions firmer when watching the market.
Reflect on the Self, Flow with the Trend.
-------------------------------
Disclaimer: This indicator is for technical analysis and market observation only and does not constitute specific investment advice. Financial markets carry significant risks; please make independent decisions based on your own circumstances.

RSI+Breadth Multi-Factor# RSI+ Breadth Multi-Factor Indicator
**Multi-factor scoring system for US market timing | 美股多因子择时评分系统**
[! (img.shields.io)](www.tradingview.com)
[! (img.shields.io)](www.tradingview.com)
[! (img.shields.io)](LICENSE)
---
## Overview | 概述
A quantitative indicator that combines **RSI**, **market breadth** (% above 20/50-day MA), and **up/down volume ratio** to generate actionable buy/sell signals for SPY, QQQ, and IWM.
这是一个结合 **RSI**、**市场广度**(站上20/50日均线比例)和 **涨跌成交量比** 的量化指标,为 SPY、QQQ 和 IWM 生成可操作的买卖信号。
---
## Features | 功能特点
| Feature | 功能 |
|---------|------|
| 🎯 Multi-factor scoring (-10 to +10) | 多因子评分系统 (-10 到 +10) |
| 📊 RSI + Breadth + Volume integration | RSI + 广度 + 成交量三重验证 |
| 🔀 Three markets: SPY, QQQ, IWM | 三大市场:SPY、QQQ、IWM |
| 🔥 Cross-market resonance detection | 跨市场共振信号检测 |
| 📈 Trend filter (MA-based) | 趋势过滤(均线判断) |
| ⏰ Auto-adapts to intraday timeframes | 自动适配日内时间周期 |
| 🎚️ Three modes: Aggressive/Standard/Conservative | 三种模式:激进/标准/保守 |
---
## Signal Reference | 信号说明
| Score | Emoji | Signal | 中文 | Action |
|:-----:|:-----:|--------|:----:|--------|
| ≥ 6 | 🚀 | **PANIC LOW** | 恐慌低点 | Strong buy 强烈买入 |
| ≥ 4 | 📈 | **BUY ZONE** | 低吸区 | Accumulate 分批建仓 |
| -3~3 | - | **HOLD** | 持有 | Hold position 持仓观望 |
| ≤ -4↑ | ⭐ | **ELEVATED** | 高估 | Hold cautious 持有但谨慎 |
| ≤ -4↓ | ⚡ | **CAUTION** | 观望 | Take profit 止盈 |
| ≤ -6↓ | ⚠️ | **REDUCE** | 减仓 | Reduce position 减少仓位 |
> **↑ = Uptrend** (price > MA) | **↓ = Downtrend** (price < MA)
### Resonance Signals | 共振信号
| Emoji | Signal | Description |
|:-----:|--------|-------------|
| 🔥 | Resonance Buy | Multiple markets in buy zone 多市场同时低吸 |
| ❄️ | Resonance Risk | Multiple markets in risk zone 多市场同时高估 |
---
## Scoring Logic | 评分逻辑
### Factors | 因子
| Factor | Weight | Buy Score | Sell Score |
|--------|--------|-----------|------------|
| **RSI** | 1x | RSI < 30 → +2, < 40 → +1 | RSI > 75 → -2, > 65 → -1 |
| **FI (50D MA%)** | Bottom focus | < 25% → +3, < 35% → +2 | > 85% → -2, > 78% → -1 |
| **TW (20D MA%)** | Top focus | < 30% → +1 | > 82% → -3, > 72% → -2 |
| **Volume Ratio** | 1x | UVOL/DVOL < 0.5 → +2 | > 2.5 → -2 |
### Breadth Symbols | 广度数据
| Market | TW Symbol | FI Symbol | Volume |
|--------|-----------|-----------|--------|
| SPY (S&P 500) | INDEX:S5TW | INDEX:S5FI | USI:UVOL/DVOL |
| QQQ (NASDAQ) | INDEX:NCTW | INDEX:NCFI | USI:UVOLQ/DVOLQ |
| IWM (Russell 2000) | INDEX:R2TW | INDEX:R2FI | USI:UVOL/DVOL |
---
## Settings | 设置说明
### Mode | 模式
- **Aggressive**: Lower thresholds, shorter cooldown (5 bars)
- **Standard**: Balanced defaults (10 bar cooldown)
- **Conservative**: Higher thresholds, longer cooldown (15 bars)
### Key Parameters | 关键参数
| Parameter | Default | Description |
|-----------|---------|-------------|
| RSI Length | 14 | RSI calculation period |
| Trend MA Length | 10 | MA for trend filter |
| Cooldown Bars | 10 | Min bars between same signals |
| Resonance Window | 3 | Bars to check for multi-market agreement |
| Min Markets | 2 | # of markets needed for resonance |
---
## Usage | 使用方法
### Installation | 安装
1. Copy the indicator code
2. In TradingView: **Pine Editor** → **New** → Paste code → **Add to Chart**
### Recommended Setup | 推荐设置
- **Timeframe**: Daily (D) for best accuracy | 推荐日线图
- **Markets**: Apply on SPY, QQQ, or IWM | 应用于SPY/QQQ/IWM
- **Mode**: Start with "Standard" | 建议从"标准"模式开始
### Intraday Mode | 日内模式
The indicator automatically detects intraday timeframes and adjusts:
- Uses only RSI + Volume factors (TW/FI are daily-only data)
- Lowers signal thresholds accordingly
指标会自动检测日内周期并调整:
- 仅使用 RSI + 成交量因子(TW/FI 仅有日线数据)
- 相应降低信号触发阈值
---
## Dashboard | 仪表盘
Displays real-time factor breakdown:
```
┌────────┬───────┬────────┐
│ Factor │ Score │ Weight │
├────────┼───────┼────────┤
│ RSI │ 1.0 │ 1x │
│ FI(50D)│ 2.0 │ Bottom │
│ TW(20D)│ -1.0 │ Top │
│ Vol │ 1.0 │ 1x │
│ Trend │ ↑ │ 10MA │
├────────┼───────┼────────┤
│ Total │ 3.0 │ HOLD │
└────────┴───────┴────────┘
```
---
## Alerts | 警报
Available alerts for each market (SPY/QQQ/IWM):
- Panic Low / Buy Zone (entry signals)
- Reduce / Caution (exit signals)
- Resonance Buy / Risk (cross-market confirmation)
每个市场(SPY/QQQ/IWM)可设置以下警报:
- 恐慌低点 / 低吸区(入场信号)
- 减仓 / 观望(出场信号)
- 共振买入 / 风险(跨市场确认)
---
## Trend Filter | 趋势过滤
**Key feature**: Risk signals (CAUTION/REDUCE) only trigger when **price is below the trend MA**.
When price is above MA (uptrend), the indicator shows **ELEVATED** ⭐ instead, preventing premature exits during strong rallies.
**核心功能**:风险信号(观望/减仓)仅在 **价格跌破趋势均线** 时触发。
当价格在均线之上(上升趋势)时,指标显示 **高估** ⭐,避免在强势上涨中过早离场。
---
## Disclaimer | 免责声明
This indicator is for **educational and informational purposes only**. It is not financial advice. Past performance does not guarantee future results. Always do your own research and consider your risk tolerance before trading.
本指标仅供 **教育和参考用途**,不构成投资建议。历史表现不代表未来收益。交易前请自行研究并考虑风险承受能力。
---
## License | 许可
MIT License - Free to use and modify with attribution.
MIT 许可证 - 可自由使用和修改,请注明出处。
---
## Author | 作者
Built with ❤️ for the trading community.
为交易社区精心打造 ❤️

Volume Delta Divergence Candle ColorThis indicator identifies divergences between price action and volume delta, highlighting potential reversal or continuation signals by coloring candles when buyer/seller pressure conflicts with the candle's direction.
**How It Works:**
The indicator analyzes real-time up/down volume data to detect two types of divergences:
🟣 **Seller Divergence (Fuscia)** - Occurs when a candle closes bullish (green) but the volume delta is negative, indicating more selling pressure despite the upward price movement. This suggests weak buying or potential distribution.
🔵 **Buyer Divergence (Cyan)** - Occurs when a candle closes bearish (red) but the volume delta is positive, indicating more buying pressure despite the downward price movement. This suggests weak selling or potential accumulation.
**Features:**
✓ Colors only divergent candles - non-divergent candles maintain your chart's default colors
✓ Uses actual exchange volume delta data (works best with CME futures and other instruments with tick-level data)
✓ Optional triangle markers above/below divergent candles for quick visual identification
✓ Clean, minimal design that doesn't clutter your chart
**Best Used For:**
- Identifying potential reversals or continuations
- Spotting weak price movements that may not follow through
- Confirming price action with underlying volume pressure
- Works on any timeframe with available volume delta data
**Note:** This indicator requires volume data from exchanges that provide tick-level information (CME futures, cryptocurrency exchanges, etc.). Results may vary on instruments with limited volume data.

Sector Monitor✅ Custom Index Strength
Key Features:
Custom Indices: It mathematically combines stocks (like HDFC + ICICI + Kotak) to create a synthetic "Private Bank Index" that you can't find anywhere else. (Note all the stocks are Equal weighted)
Performance Tracking: Shows how much a sector has moved over 1 Day, 1 Week, 1 Month, etc.
RRG (Relative Rotation): A smart algorithm that tells you if a sector is leading the market or falling behind.
Understanding the "RRG" (Relative Rotation Graph)
This is the most powerful column in the table. It compares the sector against a benchmark (usually Nifty 500 EW) to tell you the "Health" of the trend.
It classifies every sector into one of four phases , similar to a clock cycle:
💚 Leading (Strong Trend): The sector is outperforming Nifty and momentum is strong. This is where the bulls are.
💛 Weakening (Taking a Breath): The sector is still strong, but it is starting to slow down. It might be time to book profits or wait.
❤️ Lagging (Weak Trend): The sector is underperforming. It is weak and losing money compared to the market. Avoid these.
💙 Improving (Waking Up): The sector was weak, but momentum is coming back. This is often where new trends start.
✅ RRG explained
Relative Strength (RS): how the sector is doing versus the benchmark today. RS = sector price divided by benchmark price.
Strength (X-axis): compare today’s RS with RS from (default 20) days ago . If today’s RS is higher than 20 days ago → Positive strength; lower → Negative.
Momentum (Y-axis): compare today’s RS with RS from (default 5) days ago . If today’s RS is higher than 5 days ago → Improving; lower → Worsening.
Numeric walk-through
Assume benchmark = 100 today, 95 (5D ago), 90 (20D ago).
Assume sector = 110 today, 100 (5D ago), 95 (20D ago).
RS today = 110 ÷ 100 = 1.10.
RS 5D ago = 100 ÷ 95 = 1.0526.
RS 20D ago = 95 ÷ 90 = 1.0556.
Strength (today vs 20D ago): RS moved from 1.0556 to 1.10 → about +4.2% → Positive.
Momentum (today vs 5D ago): RS moved from 1.0526 to 1.10 → about +4.5% → Improving.
Label: Positive + Improving = Leading.
Quick examples for each quadrant
(numbers are RS values; you can imagine each came from “sector ÷ benchmark”)
Leading (Positive & Improving)
RS(20D) 1.00 → RS(today) 1.10 ⇒ Strength +10% (Positive)
RS(5D) 1.05 → RS(today) 1.10 ⇒ Momentum +4.8% (Improving)
Weakening (Positive & Worsening)
RS(20D) 1.00 → RS(today) 1.08 ⇒ Strength +8% (Positive)
RS(5D) 1.12 → RS(today) 1.08 ⇒ Momentum −3.6% (Worsening)
Improving (Negative & Improving)
RS(20D) 1.05 → RS(today) 0.98 ⇒ Strength −6.7% (Negative)
RS(5D) 0.95 → RS(today) 0.98 ⇒ Momentum +3.2% (Improving)
Lagging (Negative & Worsening)
RS(20D) 1.00 → RS(today) 0.90 ⇒ Strength −10% (Negative)
RS(5D) 0.95 → RS(today) 0.90 ⇒ Momentum −5.3% (Worsening)
✅ 3. How to Use the Settings (Inputs)
When you open the settings menu, here is what each section controls:
Theme / Colors
Dark Mode: Check this if you use a dark background on Trading View.
Light Mode Theme: Choose between "Blue & Purple" or standard "Green & Red" for Up/Down colors.
RRG Settings
RRG Benchmark: What are we comparing our sectors to? usually, this is NIFTY 500 EW.
If Nifty is up 1% and your sector is up 2%, your sector is "Leading."
RS Period (Score): How far back do we look to check strength? (Default: 20). Lower numbers make it react faster; higher numbers make it smoother.
Momentum Lookback: How fast is the trend changing? (Default: 5).
Table Settings
Show Col 1 / 2 / 3: You can choose to see up to 3 timeframes plus the RRG column.
Timeframes (1D, 1W, 1M...): Set these to match your trading style.
Day Trader: Set Col 1 to 1D (1 Day) and Col 2 to 1W (1 Week).
Investor: Set Col 1 to 1M (1 Month) and Col 2 to 6M (6 Months).
Sort By: This is crucial. You can sort the table by "RRG" (to put the strongest sectors at the top) or by "Column 1" (to see today's biggest gainers).
Rows Shown: Limit the table to the "Top 10" or "Top 20" if the table is too big for your screen.
Symbol Selection
This is where the magic happens. The script comes pre-loaded with groups like "NBFC," "Housing Finance," etc.
Checkbox: Turn a specific sector ON or OFF in the table.
Input Box: You can actually edit the stocks!
Example: The input might look like NSE:TCS+NSE:INFY.
If you want to add Tech Mahindra, you simply add +NSE:TECHM to the text. The indicator will instantly recalculate the sector based on your new list.
✅ 4. Adjusting Inputs for Your Time Horizon
The logic is simple:
Lower Numbers: Make the indicator faster and more sensitive. It reacts quickly to price jumps but creates more "noise" (false signals).
Higher Numbers: Make the indicator slower and smoother. It filters out small corrections but reacts late to new trends.
Short-Term (Intraday / Fast Swing)
Recommended Inputs: Strength 10 | Momentum 3
Why: You need speed. By lowering the Strength to 10 days and Momentum to 3 days, the RRG will react instantly to sudden bursts of buying.
Best For: Catching "Micro-Rotations" (e.g., a sector suddenly waking up for a 2-3 day rally).
Trade-off: You will see sectors jump between "Leading" and "Weakening" very frequently.
Medium-Term (Standard Swing Trading)
Recommended Inputs: Strength 20 | Momentum 5 (Default)
Why: This is the "Goldilocks" zone. It ignores the daily noise but is fast enough to catch a trend that lasts for a few weeks.
Best For: Identifying the main theme of the current month.
Trade-off: Balanced. It might be slightly too slow for scalpers and slightly too fast for multi-year investors.
Long-Term (Position Investing)
Recommended Inputs: Strength 60 | Momentum 15
Why: A strength lookback of 60 (approx. 1 quarter) ensures you are only looking at major structural trends. A momentum of 15 ensures that a 2-day drop doesn't scare you out of a "Leading" sector.
Best For: Building a portfolio to hold for 6–12 months. If a sector is "Leading" here, it is in a massive bull run.
Trade-off: Very slow. By the time a sector turns "Leading," the trend has already been established for a while.
✅ 5. The "Secret" Tooltip Feature
Don't forget to hover your mouse cursor over the RRG Status text in the table (e.g., over the word "Leading").
A detailed box will appear showing:
Math: Exact Strength and Momentum scores.
Strategy: A text advice (e.g., "Trend is strong. Look for breakouts").
Constituents: The exact list of stocks used to calculate that sector's performance. This saves you from having to guess which stocks belong to that group.

ROMAN INDIThis script creates an on-chart information panel / watermark that summarizes the most important technical and contextual data for the current symbol in one place. It’s designed as a compact trading dashboard overlay, fully configurable from the Inputs menu.
1. General instrument info
The table shows:
Company name + market cap
Market cap is calculated from shares_outstanding_total * close and formatted in M / B / T.
Ticker + timeframe (e.g. AAPL, 1D, AAPL, 1H, etc.).
Sector & industry (when available from syminfo).
You can choose the panel position (Top/Middle/Bottom & Left/Center/Right) and text size/color from the inputs.
2. Volatility & stop-loss (ATR block)
Calculates ATR(14) and the ATR as % of price.
Colors ATR with an emoji:
🔴 = high volatility (above red threshold)
🟡 = medium
🟢 = low
Computes a dynamic stop loss:
Source price can be: Today / Yesterday / 2 Days Ago.
Stop = base price − ATR × user-defined multiplier.
Also calculates the distance from close to stop in percent and marks it:
🟢 if distance > 5%
🟡 if distance > 2%
🔴 otherwise
When price crosses the stop level (or if the stop is very tight and marked 🔴), a label is plotted just ahead of the current bar:
Shows either “SELL” (if close ≤ stop) or the stop price.
3. Moving averages distance row
Calculates SMA 50 / 150 / 200.
Shows a single row:
MA50: +X.XX% | MA150: +Y.YY% | MA200: +Z.ZZ%
Values are the percentage distance between close and each MA (positive/negative).
This row can be toggled on/off via the inputs.
4. Volume analysis
Uses a 20-period average volume as baseline.
Computes:
Absolute volume difference vs. 20-SMA (in K/M units).
Percent difference vs. average.
Adds:
🔴 if current volume < average
🟡 if up to +10% above average
🟢 if more than +10% above average
Detects streaks of rising or falling volume (last 3 bars):
⬆️ / ⬆️⬆️ / ⬆️⬆️⬆️ for 1–3 bars of increasing volume
⬇️ / ⬇️⬇️ / ⬇️⬇️⬇️ for 1–3 bars of decreasing volume
Final row example:
ΔVol: 1.25M (15.32%) 🟢 ⬆️⬆️
5. Earnings countdown
Uses earnings.future_time to detect the next earnings date.
Shows:
Earnings: X days remaining
(only if there is a future earnings date and the option is enabled).
6. RSI (momentum)
Calculates RSI(14).
Displays:
Current RSI value.
Trend arrow vs. previous bar: ⬆️ / ⬇️ / (no arrow).
Emoji color:
🔴 when RSI > 70 (overbought)
🔴 when RSI < 30 (oversold)
🟢 otherwise
Example:
RSI (14): 63.25 🟢 ⬆️
7. CCI (trend strength & short-term swings)
Calculates CCI(14) on hlc3.
Tracks the direction of CCI (up / down / flat) and interprets it:
If CCI is falling:
100 → “Overbought 🔴”
0 to 100 → “Negative Momentum 🟡”
−100 to 0 → “2-4 Days Down 🟠”
< −100 → “Oversold 🔴”
If CCI is rising:
100 → “Overbought 🔴”
0 to 100 → “2-4 Days Up 🟢”
−100 to 0 → “Building Momentum 🟡”
< −100 → “Oversold 🔴”
The row shows value, direction arrow and text interpretation.
Example:
CCI (14): -45.32 🟡 ⬆️ Building Momentum 🟡
8. Market context: VIX & Bitcoin row
Tracks:
VIX (CBOE:VIX)
Bitcoin (BINANCE:BTCUSDT)
If the current chart is directly on one of these symbols, it uses the live close; otherwise it pulls the data via request.security.
Shows last price of VIX and BTC plus trend arrows based on the last 3 closes (up/down streak).
Example:
VIX: 15.23 ⬆️ | BTC: 113,000 ⬇️⬇️
Summary
In short, ROMAN INDICATOR is an overlay info-panel that combines:
Instrument fundamentals (name, sector, industry, market cap)
Volatility & ATR-based stop-loss engine
Distance from major moving averages (50/150/200)
Volume vs. average with streak detection
RSI & CCI with clear emoji-based interpretation
Earnings countdown (days to next report)
Global context via VIX + Bitcoin row
Everything is configurable in the Inputs, making it a convenient single-glance trading dashboard on top of your chart.

⭐ Silver HUD v14.6 ⭐Silver HUD v14.6 is an enhanced Pine Script v5 indicator for micro silver futures (SIL) trading on TradingView, featuring a compact 2-column bottom-right HUD with weighted scoring across 5 engines (trend, flow, momentum, PB, turbo), 2H structure arbitration, divergence detection, volume surge analysis, BUY/SELL arrows, and risk warnings. Expanded from v14.5 with dedicated DIV/VOL rows for better signal context on 5m charts.
Multi-Engine Scoring
Trend Engine
EMA20/50 alignment + VWAP direction (1.001%/0.999% thresholds): UP/DOWN/MIXED scores 100/60/20.
Flow Engine
CCIOBV (CCI20 + OBV EMA13 sync) + QQE (RSI14 smoothed with trailing volatility): dual UP/DOWN = strong flow (100), mixed (60).
Momentum
RSI14/MFI14 >55 (UP=100), <45 (DOWN=100), else NEUTRAL (60).
PB (Pullback)
EMA20 deviation: -0.4% to +1.2% = OK (100), ≥1.2% CHASE (70/40), DEEP (30/80 for long/short).
Turbo
ATR14 percentile (>70 EXPANDING, <30 FADE) + BB20 width percentile (<20 SQ): SQ+EXPANDING=BREAKOUT (100).
Weighted Totals
BUY: flow(30%)+mom(25%)+PB(25%)+trend(10%)+turbo(10%); SELL adjusts turbo(20%)/PB(15%). Thresholds: BUY≥75, SELL≥72.
Advanced Features
2H Arbitration
Swing HH/HL/LL/LH detection resolves BUY/SELL conflicts; UP (HH/HL) favors longs, DOWN (LL/LH) shorts.
Divergence
RSI-based: price HH without RSI HH = BEAR DIV; price LL without RSI LL = BULL DIV.
Volume Surge
2x 20-SMA or 80th percentile: BULL/BEAR SURGE (directional), SURGE (neutral).
Signals & Risk
Raw triggers filtered (no DEEP PB BUY, no DOWN trend BUY, UP flow required); final uses 2H tiebreaker. RISK flags DIV, surges, DEEP PB, trend conflicts, score ties. Tiny BUY/SELL arrows on raw signals.
HUD Layout
14-row table: TREND/FLOW/MOM/PB/TURBO/FINAL/BUY*/SELL*/2H/DIV/VOL/RISK/Threshold. Stars rate scores (★★★★★=90+), color-coded statuses, gold FINAL. Perfect for SIL scalpers needing confluence + risk at a glance.

Silver 30m HUD — Trend / Flow / PB / VWAP / TurboSilver 30m HUD is a streamlined Pine Script v5 indicator optimized exclusively for 30-minute silver futures (SIL) charts on TradingView. It displays a compact 2-column middle-right table analyzing trend, flow, momentum, pullback, VWAP, turbo, and final signals with safety stars and risk warnings. Enforces 30m timeframe usage via label alert on other periods.
Key Engines
Trend Fusion
Combines 30m (close vs SMA60) with 2H higher timeframe for UP/DOWN/FLAT consensus; MIXED on divergence. Serves as primary directional filter.
Flow Detection
Identifies volume surges (>2.2x 20-period SMA) as BULL/BEAR SURGE, else defaults to candle direction (UP/DOWN). Captures aggressive buying/selling pressure.
Momentum Composite
QQE/RSI/MFI blend: both >55 = UP, both <45 = DOWN, otherwise EXHAUST. Flags overextended moves.
Pullback Safety
Rates position vs SMA20/50: above both = OK, above 20 but below 50 = Weak, below both = Danger. Prevents chasing extended trends.
VWAP & Turbo
Price vs session VWAP (UP/DOWN); turbo flags >1% candle moves as UP/DOWN acceleration or EXHAUST.
Signals & Risk
Final Signal Logic
BUY requires UP trend + OK PB + UP VWAP + no DOWN mom; SELL needs DOWN trend + non-OK PB + DOWN VWAP; EXHAUST mom = CHOP; else WAIT.
Safety Ratings
BUY stars: 5🟩 (perfect confluence), 3🟩 (basic BUY); SELL: 4🟥 (full signal), 3🟥 (exhaustion).
Risk Alert
Triggers ⚠️ on BUY signals with 2H DOWN trend and <0.20 from resistance (distR), warning multi-timeframe conflict + overhead supply. Displays S/R levels and distances in mintick format.
HUD Layout
12-row table prioritizes scannability: metrics left (gray), statuses right (color-coded green/red/gray), bottom shows Dist to R/S, levels, and RISK. Ideal for quick 30m SIL scalping decisions balancing confluence and safety.

Dan Zanger Master Trading System [Premium]
Dan Zanger Master Trading System
Overview
This indicator implements the legendary trading methodology of Dan Zanger, who famously turned $10,775 into over $42 million using pattern recognition and volume analysis. The system combines professional-grade pattern detection, volume analysis, and risk management into a comprehensive trading solution.
----------------------------------------------------------------------------------
Core Features
1. Zanger Volume Ratio (ZVR)
The cornerstone of Zanger's methodology—volume confirms everything.
- Dynamic volume classification: Extreme (≥2x), High (≥1.65x), Moderate (≥1.25x), Low
- Bar coloring by volume intensity for instant visual feedback
- Volume dry-up detection: Identifies when volume contracts to <50% of average—Zanger's key signal that precedes explosive breakouts
2. Pattern Detection Engine
Automatically detects Zanger's favorite chart patterns:
🚩 Bull Flag - 15%+ pole with orderly 20-50% retracement, downward-sloping flag, declining volume
☕ Cup & Handle - U-shaped recovery (12-35% depth), handle in upper half, no undercut of cup low
△ Ascending Triangle - Flat resistance with higher lows, converging range, multiple resistance touches
▽ Descending Triangle - Flat support with lower highs (bearish warning)
◇ Symmetrical Triangle - Converging trendlines with contracting volume
▬ Flat Base - Tight consolidation (<15% range), price near highs, volume drying up
═ Channel - Up/Down/Horizontal channels with parallel bounds
3. Trend Analysis
Four Moving Averages: 10/20/50/200-period (selectable: SMA, EMA, WMA, VWMA)
Trend Score (0-100): Quantifies trend strength based on MA positioning and direction
Golden Cross/Death Cross detection with visual markers
4. Zanger-Style Breakout Detection
Breakouts require ALL of these conditions:
- ✅ Price exceeds resistance with conviction
- ✅ Volume confirms (≥1.5x average)
- ✅ Strong close (upper 25% of bar range)
- ✅ Above rising 50-day MA
- ✅ Preceded by volume dry-up (ideal)
5. "Never Chase" Protection
Zanger's #1 rule implemented: Warns you when price is >5% above breakout level. This prevents costly chasing entries.
6. Risk Management System
Built-in position management following Zanger's rules:
Stop Loss: Default 7% (Zanger uses 5-7%)
Profit Target 1: 15% (take partial profits)
Profit Target 2: 30% (let winners run)
Trailing Stop: Activates after PT1, trails at 10% from highs
Visual stop loss and profit target lines on chart
------------------------------------------------------------------------------------
Dashboard
Real-time information panel showing:
Current ZVR value and classification
Volume dry-up status
Trend score and bias
MA positioning
Active pattern detection
Current signal status
Position P&L and stop levels
---------------------------------------------------------------------------------
Alert System
15+ configurable alerts including:
Pattern breakouts (Bull Flag, Cup & Handle, Triangles, Flat Base)
Extreme volume detection
Volume dry-up alerts
Stop loss/trailing stop triggers
Profit target notifications
Chasing warnings
--------------------------------------------------------------------------------
Settings
Fully customizable parameters:
ZVR thresholds and lookback
MA types and lengths
Pattern detection toggles
Breakout sensitivity
Stop loss and profit target percentages
Visual styling and colors
---------------------------------------------------------------------------------
Zanger's Key Principles Implemented
Volume is King – Every breakout requires volume confirmation
Never Chase – Built-in warning when >5% above breakout
Cut Losses Quickly – 5-7% stop losses
Let Winners Run – Trailing stops after first target
Trade with the Trend – Only buy above rising 50-day MA
Volume Dry-Up – Best breakouts follow volume contraction
Strong Closes – Look for closes in upper 25% of bar
----------------------------------------------------------------------------------
Best Practices
Use on daily charts for swing trading (Zanger's primary timeframe)
Works on stocks with adequate volume (avoid illiquid names)
Combine with market analysis (Zanger trades strong markets)
Wait for pullbacks when chasing warning appears
Honor your stops – capital preservation is priority
-----------------------------------------------------------------------------------
Disclaimer
This indicator is for educational purposes. Past performance does not guarantee future results. Always do your own research and use proper risk management.

6EMA & SMA with alertOverview
This indicator is designed to combine multiple moving averages, higher-timeframe levels, and flexible alerts into a single tool. It helps you monitor trend direction, dynamic support/resistance, and key daily/weekly/monthly levels without loading several separate indicators.
Main Features
1 12 Moving Averages in One Indicator
・Plots a total of 12 lines: 6 EMAs and 6 SMAs.
・All lengths and sources are fully configurable from the settings, so you can adapt them to your own style and timeframe.
2 Slope-Based Color Change
・One EMA and one SMA are colored based on their slope (rising vs. falling).
・This makes it easy to visually confirm when the medium/long-term bias is turning up or down.
3 Price-vs-MA Alerts
・You can enable alerts when price touches or crosses any selected EMA or SMA.
・Direction can be set to “Up”, “Down”, or “Both”, and you can choose to trigger only on bar close.
・The script can also send detailed alert() messages containing the symbol, timeframe, price, and line value at the moment of the cross.
4 Daily / Weekly / Monthly High–Low Levels
・Optionally display the current Daily, Weekly, and Monthly high/low levels as rays extended to the right.
・Each set of levels can be shown or hidden individually, and has its own color, style, and width options.
・Labels (DH/DL, WH/WL, MH/ML) are attached at the right side of each line for quick identification.
Notes & Disclaimer
This indicator is for charting and alerting purposes only. It does not open, close, or manage any positions.
It does not guarantee any specific results or performance. All examples are for educational and informational purposes only.
Always test and adjust the settings on your own symbols and timeframes, and use proper risk management when applying it to live trading.

MNQ Momentum Suite – Intraday Confluence Dashboard (1-5M)MNQ Momentum Suite is a multi-factor intraday momentum dashboard designed primarily for MNQ / NQ on the 1M–5M timeframes during the New York session.
Instead of staring at 3–4 separate indicators, this script combines them into one clean pane
DMI / ADX → who’s in control (+DI vs –DI) and how strong the move is
Momentum MA Slope (T3 or EMA) → directional bias and trend quality
Squeeze Logic (BB vs Keltner) → volatility compression & expansion zones
Composite Momentum Score (–4 to +4) → single number capturing total confluence
Color-coded Dashboard Table → instant Bull / Bear / Flat status for each component
Core Components
1️⃣ Composite Momentum (Main Histogram)
Score range : –4 to +4
Built from 4 building blocks :
DMI direction (Bull/Bear)
ADX strength above threshold
MA slope direction (up/down)
Squeeze direction (after it fires)
Interpretation:
+3 / +4 → strong bullish confluence
+1 / +2 → mild bullish bias
0 → mixed / no edge
–1 / –2 → mild bearish bias
–3 / –4 → strong bearish confluence
2️⃣ DMI / ADX Block
Uses ta.dmi() under the hood.
DI spread histogram (teal/orange) shows which side is in control.
White ADX line measures trend strength – higher = cleaner moves, low = chop.
3️⃣ Momentum MA Slope (T3 / EMA)
User can choose T3 or EMA for the slope engine.
Slope histogram color:
Aqua → MA sloping up (bull-friendly)
Fuchsia → MA sloping down (bear-friendly)
4️⃣ Squeeze (BB vs Keltner)
Yellow dots mark when Bollinger Bands are inside Keltner Channels (volatility squeeze).
When the squeeze releases and price closes on one side of both BB basis and Keltner basis, the script flags a bullish or bearish squeeze fire that feeds the composite score.
Dashboard Table (Top-Right) : The table gives a fast, text-based read of the environment:
DMI Dir – Bull / Bear / Flat
ADX – Numeric trend strength
Slope – Up / Down / Flat based on chosen MA
Squeeze – Building / Fired Up / Fired Down / Idle
Row text is color-coded:
Green when that metric is bull-friendly
Red when it is bear-friendly
Gray/white when neutral
This makes it very easy to glance at the table and see if the environment is mostly green (long-friendly) or mostly red (short-friendly).
Session & Histogram Controls
Use NY Session Filter?
When enabled, all logic is focused on the defined NY session (default 09:30–16:00 exchange time).
how Histograms Only in NY Session?
true → plots only during the NY session (good for live trading focus).
false → plots on all bars, including overnight, so you can study past days and pre-/post-market behavior.
Alerts
Two built-in alert conditions are provided:
Strong Bull Momentum – Composite ≥ 3 during the session.
Strong Bear Momentum – Composite ≤ –3 during the session.
Use these as “heads-up” momentum pings, then confirm with your own price-action, VWAP, HTF levels, and liquidity zones.
Recommended Use
Primary instruments: MNQ / NQ futures, but it can be applied to any intraday symbol.
Primary timeframes: 1M to 5M.
Designed as a confluence and filter tool, not a stand-alone entry system.
Works especially well combined with:
VWAP
10 EMA
Pre-NY and RTH highs/lows
FVG/IFVG and liquidity zones
As with any tool, this is not financial advice and does not guarantee results. Always combine with risk management and your own playbook.

Sequence_VovaDescription:
This indicator implements a strict, rule-based Structural Trend Sequence system designed to eliminate guesswork in trading.
Key Features:
Structural Stop-Loss (Critical Level): A dynamic support/resistance line that never moves against the trend.
Uptrend (Green Line): Only moves up when a New High is established. It locks in place during consolidation, acting as a secure trailing stop.
Downtrend (Red Line): Only moves down when a New Low is established.
Clear Signals (No Repainting on Close):
B (Buy): Triggers when the price closes above the red Critical Level, signaling a confirmed structural reversal to the upside.
S (Sell): Triggers when the price closes below the green Critical Level, signaling a structural break and an exit point.
Auto Trendlines: Automatically draws extended trendlines connecting the last two structural Highs (S-to-S) and the last two structural Lows (B-to-B) to visualize the current market angle and potential breakout zones.
Global Trend Filters: Includes the EMA 200 (Blue) as a "Global Compass" to filter trades in the direction of the major trend, along with SMA 20 and SMA 40 for immediate context.
Integrated Market Scanner (Top 40): Features a built-in dashboard panel that monitors the Sequence Status (Up/Down/Signal) for the Top 40 US Stocks in real-time directly on your chart.

PIPSTA - ORB# PIPSTA - ORB - Complete Explanation
This is a sophisticated **Opening Range Breakout (ORB)** indicator for TradingView that tracks price movements during the first minutes of a trading session and identifies breakout opportunities.
---
## 🎯 Core Concept: What is ORB?
**Opening Range Breakout** is a trading strategy based on the idea that the first minutes of trading establish key support/resistance levels. When price breaks above (bullish) or below (bearish) these levels with conviction, it often signals a strong directional move for the rest of the session.
---
## 📊 Key Features
### 1. **Multi-Stage ORB Tracking**
The indicator tracks **4 different opening ranges simultaneously**:
- **ORB 5**: First 5 minutes (fastest, most volatile)
- **ORB 15**: First 15 minutes (balanced signals)
- **ORB 30**: First 30 minutes (more reliable)
- **ORB 60**: First 60 minutes (slowest, most confirmed)
Each stage establishes a **High** and **Low** level. The active ORB (usually the largest completed one) is used for breakout detection.
---
### 2. **Breakout Detection System**
**How it works:**
- Monitors when price closes **above ORB High** (bullish breakout) or **below ORB Low** (bearish breakout)
- Requires a **buffer** (default 0.2%) to filter false breakouts
- Tracks **cycles**: Breakout → Retest → Re-breakout sequences
- Shows labels on chart marking breakouts with cycle numbers
**Signal Modes:**
- **First Only**: Shows only the first breakout in each direction per day
- **Track Cycles**: Shows multiple breakouts as price oscillates (up to configurable max cycles)
---
### 3. **Advanced Filtering**
The indicator includes **optional filters** to improve signal quality:
#### **Volume Filter**
- Compares current volume to moving average
- Requires volume ≥ X multiplier (default 1.5×) for breakout confirmation
- **Strong Volume Override**: If volume exceeds threshold (default 2×), bypasses other filters
#### **Trend Filter**
- Multiple methods: VWAP, EMA, SuperTrend, or combinations
- Only shows breakouts **aligned with the trend**
- Prevents counter-trend trades with lower success rates
#### **FVG (Fair Value Gap) Filter**
- Detects price gaps from strong momentum moves
- Requires breakout to occur near a FVG for confirmation
- Shows FVG boxes on chart (optional)
#### **Higher Timeframe (HTF) Bias**
- Checks daily/4H/weekly trend before taking breakouts
- Displays HTF bias in dashboard (✅ Aligned / ⚠️ Counter-Trend)
- Doesn't block signals—just warns you
---
### 4. **Retest & Failed Break Detection**
**Retest Logic:**
- After breakout, if price returns to ORB level → shows "🔁 RETEST" label
- Tracks minimum distance traveled (default 0.5%) to avoid labeling tiny bounces
- Useful for re-entry opportunities
**Failed Breaks:**
- If price breaks out but returns inside range within X bars (default 5) → marks as "⚠️ FAILED BREAK"
- Helps identify weak breakouts quickly
- Adjusts cycle count accordingly
---
### 5. **Risk Management & Position Sizing**
#### **Automatic Target/Stop Calculation**
**Stop Loss Methods:**
1. **Smart Adaptive** (Recommended): Adjusts to volatility automatically
2. **ATR-Based**: Uses Average True Range with multiplier
3. **ORB %**: Fixed percentage beyond ORB level
4. **Swing**: Places at recent swing high/low
5. **% Based**: Simple percentage from entry
**Take Profit Targets:**
- **TP1** (1R): Conservative target, 1:1 risk/reward
- **TP1.5** (1.5R): Intermediate target
- **TP2** (2R): Standard target for most traders ⭐
- **TP3** (3R): Extended target for strong trends
*R = Risk units (1R = distance from entry to stop loss)*
#### **Position Sizing Calculator**
Automatically calculates:
- **Max shares** to buy based on your risk tolerance
- **Position value** in dollars
- **Risk amount** (max loss if SL hit)
- **Risk/Reward ratio** for the trade
**Risk Modes:**
- **$ Amount**: Risk fixed dollar amount per trade (e.g., $150)
- **% of Account**: Risk percentage of total account (e.g., 1% of $25,000 = $250)
**Safety Limits:**
- Max position size % of account (prevents over-leverage)
- Multi-currency support with live exchange rates
---
### 6. **Real-Time Dashboard**
Displays comprehensive trade information:
**Session Status:**
- Market open/closed status
- Session type (Regular/Extended Hours/Pre-Market)
- Current ORB stage and completion status
**ORB Metrics:**
- Range size ($0.50, 2.5% width)
- Volatility meter (🔥🔥🔥 Extreme / 🔥 Medium / ⚪ Low)
- Volume status (if filter enabled)
- Trend direction (if filter enabled)
- HTF bias
**Trade Setup (when breakout occurs):**
- Entry price
- Stop Loss ($ and %)
- Target prices (TP1, TP1.5, TP2, TP3) with percentages
- Risk/Reward ratio
- Position size (shares and $ value)
- Risk amount
**Session Statistics:**
- Wins/Losses count
- Win rate %
- Total R earned
- Best/Worst trade
---
### 7. **Visual Elements**
**On Chart:**
- **Colored bands** showing active ORB levels (High/Low/Mid)
- **Breakout labels** (🔼 BREAKOUT UP, 🔽 BREAKOUT DOWN)
- **Retest labels** (🔁 RETEST UP/DOWN)
- **Failed break labels** (⚠️ FAILED BREAK)
- **TP/SL lines** extending from entry point
- **Edge labels** showing which ORB stage is active
- **FVG boxes** (if enabled)
**Customizable:**
- Colors for each ORB stage
- Label sizes (Tiny/Small/Normal/Large/Huge)
- Label format (Simple vs Detailed)
- Background transparency
- Line styles
---
## ⚙️ Session Management
**Session Modes:**
- **Auto-Detect**: Uses symbol's native exchange hours (recommended)
- **New York**: NYSE/NASDAQ (09:30-16:00 EST)
- **London**: LSE (08:00-16:30 GMT)
- **Tokyo**: TSE (09:00-15:00 JST)
- **Sydney**: ASX (10:00-16:00 AEST)
- **Frankfurt**: XETRA (09:00-17:30 CET)
- **Custom**: Define your own hours
**Extended Hours Support:**
- Include pre-market (04:00-09:30) and after-hours (16:00-20:00)
- ORB tracking works during extended hours
- Dashboard shows appropriate status
---
## 🎵 Workflow Example
1. **Market opens at 09:30**
2. **First 5 minutes**: ORB5 builds (tracks High/Low)
3. **At 09:35**: ORB5 completes → becomes active
4. **At 09:45**: ORB15 completes → becomes active (takes priority)
5. **Price action**: Close above ORB15 High + buffer → **BREAKOUT UP**
6. **Indicator displays**:
- 🔼 BREAKOUT UP label on chart
- Entry line at ORB High
- TP1/TP2/TP3 lines calculated
- SL line below entry
- Dashboard shows trade parameters
- Position size calculated
7. **Price returns to ORB**: Shows 🔁 RETEST label
8. **If TP2 hit**: Lines freeze, dashboard updates, session stats increment
---
## ⚠️ Important Notes
### **Limitations:**
- May produce false signals in choppy/ranging markets
- Best on **5-minute charts** during **regular trading hours**
- Requires **liquid stocks** (>1M daily volume)
- Not suitable for all market conditions
### **Best Practices:**
- **Paper trade first** to understand signals
- Use proper risk management (1-2% risk per trade)
- Combine with overall market analysis
- Recommended: Track Cycles mode with Volume + Trend filters
### **Timezone Fix:**
If ORB appears 1 hour off:
- Right-click chart → Settings → Symbol → Timezone
- Set to exchange timezone (e.g., America/New_York for NYSE)
---
## 🔔 Alert System
Configurable alerts for:
- Breakout UP/DOWN
- Retest UP/DOWN
- Failed breaks
- Stage completion
All alerts include ticker, price, and ORB stage information.
---
## 💡 Credits & Purpose
**Based on:** Mark Fisher's Opening Range Breakout concept
**Enhanced with:** Modern technical analysis techniques
**Purpose:** Educational and informational—not financial advice
**Author:** OrenLuxy
**Disclaimer:** Trading involves substantial risk. Past performance doesn't guarantee future results. Always do your own research.
---
This indicator is a **complete ORB trading system** with institutional-grade risk management, multi-filter confirmation, and comprehensive position sizing—all automated and visualized in real-time. Perfect for day traders who want a systematic approach to opening range breakouts.

BullTrading Axis Ribbon (MTF)BullTrading Axis Ribbon (MTF)
BullTrading Axis Ribbon 是一条「高周期主轴 + 自适应包络带」的趋势彩带,用来刻画价格围绕关键均衡轴的磁吸区、扩散区与趋势方向。
• 主轴(Axis Ribbon):使用更高时间级别的价格数据,在当前周期上映射一条「日内趋势中轴」。默认适合在 3m / 5m 图上调用 15m 主轴。
• 中枢区(Core Zone):主轴上下的窄区间,用彩带填充显示。当价格在中枢区震荡时,代表围绕均衡轴的磁吸与盘整。
• 外圈带(Outer Band):位于中枢之外的扩展区,用于观察顺势扩张与「过热」区域,可选线框或填充显示。
• 颜色逻辑:
• 轴线彩带根据趋势方向与中枢状态变色:上升(绿色)、下降(红色)、中枢磁吸(黄色)、整理(灰色)。
• 左下角状态灯同步给出当前轴向状态(上涨 / 下跌 / 中枢 / 整理)。
使用建议
• 在 3m / 5m 作为短周期信号时,用 Axis Ribbon 作为「大级别方向过滤」与「高概率回踩区域」参考。
• 价格长时间贴着外圈带运行,可视为顺势加速或过热区;频繁回到中枢,则倾向震荡与均值回归。
• 指标本身不直接给出买卖点,更适合与你已有的进场离场系统配合,用于方向过滤和环境判断。
本指标仅用于技术研究与图表分析,不构成任何投资建议或交易信号,请根据自身风险承担能力独立决策。
BullTrading Axis Ribbon (MTF)
BullTrading Axis Ribbon is a trend ribbon built from a higher-timeframe core axis + adaptive envelope bands.
It depicts the magnet zone, expansion zone and trend direction of price around a key equilibrium axis.
• Axis (Axis Ribbon): Uses higher-timeframe price data to project an “intraday trend spine” onto the current chart. By default it works well using a 15m axis on 3m / 5m charts.
• Core Zone: A narrow band above and below the axis, displayed as a filled ribbon. When price oscillates inside the Core Zone, it reflects magnet behavior and consolidation around the equilibrium axis.
• Outer Band: An extended area outside the Core Zone, used to observe trend extension and potential “overheated” zones. It can be shown as simple lines or as a filled band.
• Color Logic:
• The axis ribbon color changes with trend direction and core state: uptrend (green), downtrend (red), core/magnet (yellow), ranging/flat (gray).
• A status lamp in the bottom-left corner simultaneously shows the current axis state (Up / Down / Core / Flat).
Usage Suggestions
• When using 3m / 5m as your signal timeframe, treat Axis Ribbon as a higher-timeframe bias filter and as a reference for high-probability pullback areas.
• If price rides along the Outer Band for an extended period, it can be interpreted as trend acceleration or a potential overheated zone; if price frequently returns to the Core Zone, the market tends to be ranging with mean-reversion behavior.
• The indicator itself does not directly generate entry/exit signals. It is best used together with your existing entry/exit systems, as a tool for directional filtering and market-regime assessment.
This indicator is intended solely for technical research and chart analysis.
It does not constitute investment advice or a trading signal. Please make independent decisions according to your own risk tolerance.

Pradeep Bonde (Stockbee) Momentum Pro TradingView Description for "Pradeep Bonde (Stockbee) Momentum Pro"
-----------------------------------------------------------------------------------------------
Pradeep Bonde (Stockbee) Momentum Pro
The Complete Momentum & Episodic Pivot Trading System
Based on the proven methodology of Pradeep Bonde (Stockbee) — the legendary momentum trader and "Mentor to $100 Million Traders."
----------------------------------------------------------------------------------------------
📈 OVERVIEW
This indicator implements Stockbee's complete momentum trading system, designed to identify high-probability swing trade setups. It combines Episodic Pivots, Momentum Bursts, Anticipation Setups, and IBD-style Relative Strength analysis into a single professional tool.
----------------------------------------------------------------------------------------------
🔥 KEY FEATURES
1. EPISODIC PIVOT DETECTION (EP)
The crown jewel of Stockbee's methodology:
- Detects 10%+ gaps on massive volume (2x+ average) — true catalyst-driven breakouts
- Identifies Delayed EP Breakouts — consolidation after initial gap, then secondary breakout
- Tracks days since EP for optimal entry timing
- PEAD (Post Earnings Announcement Drift) opportunities
2. MOMENTUM BURST SIGNALS
- 4%+ moves on volume 40%+ above average
- Quality filters: Requires narrow range before breakout, close near high of day
- Tiered signals: Momentum Burst → Strong Momentum → Exceptional Momentum
- "Quality" prefix (★) indicates setups with all filters passed
3. ANTICIPATION SETUP DETECTION
Pre-breakout coiling patterns:
- Detects 1-3 week tight consolidations after prior 15-25%+ advances
- Volume dry-up analysis during consolidation (< 60% of prior average)
- Anticipation score helps identify coiled springs before they break out
4. IBD-STYLE RELATIVE STRENGTH
- Custom RS Rating (1-99 scale) weighted by recent performance
- RS New High detection — signals institutional accumulation
- Weighted calculation: 40% Q1, 20% Q2, 20% Q3, 20% Q4 performance
5. BAG HOLDER PROTECTION ⚠️
Stockbee's cardinal rule: "Never buy after 3+ consecutive up days"
- Automatic detection of late entries
- Visual warnings on chart
- Quality score penalty for bag holder territory
6. EXIT SIGNAL SYSTEM
- First down day after 3+ up days = EXIT
- Close below 5-day MA trigger
- Clear visual EXIT labels on chart
Signal Thresholds:
- 🎯 PERFECT: Score ≥ 8.5 (highest probability trades)
- 💪 STRONG BUY: Score ≥ 7.5
- BUY: Score ≥ 6.5
- WATCH: Score 5.0 - 6.5
- ⚠️ LATE ENTRY: High score but in bag holder territory
- BEARISH: Score ≤ 3.0 and below trend MA
----------------------------------------------------------------------------------------------
🎨 VISUAL ELEMENTS
Chart Labels
- 🔥 EP — True Episodic Pivot (10%+ gap)
- ★EM / ★MB — Quality Exceptional/Momentum Burst
- ★BO — Quality Breakout
- ⚡ — Coiling setup (pre-breakout)
- RS↑ — Relative Strength new high
- LATE — Bag holder warning
- EXIT — Exit signal
Chart Elements
- Moving Averages: 5, 10, 20, 50, 200 MA with professional styling
- Consolidation Boxes: Shows prior consolidation range on breakouts
- Stop/Target Lines: Automatic levels on active signals
- Background Colors: Gradient highlighting for signal strength
Dashboard (Top Right)
Professional 3-column display showing:
- Signal status & total score
- Visual score bars for each component
- Key metrics (RS Rating, Volume Ratio, Close Position)
- Filter status (Trend, Entry Day)
- Trade setup (Risk/Reward ratio)
----------------------------------------------------------------------------------------------
⚙️ CUSTOMIZABLE SETTINGS
General
- Show/hide labels, backgrounds, consolidation boxes
- Trend filter (50 MA, 200 MA, or Both)
- Bag holder avoidance toggle
Momentum Burst
- Threshold percentages (4%, 6%, 8%+)
- Require narrow range before breakout
- Close near high threshold
Episodic Pivot
- Consolidation period (20-60 days)
- Consolidation range (5-20%)
- Gap threshold (10%+)
- Volume multiple (2x+)
Narrow Range / Contraction
- Lookback period
- Range threshold
- Days required before breakout
Volume Analysis
- Average period (50 days)
- Spike threshold (1.4x = 40% above average)
- Volume vs previous day requirement
- Dry-up threshold for consolidation
Relative Strength
- Minimum RS rating (80)
- Strong RS rating (90)
- EPS growth minimum filter
Display Options
- Toggle for each signal type
- Debug panel for troubleshooting
- Color customization
----------------------------------------------------------------------------------------------
🔔 ALERTS
Comprehensive alert conditions:
- 🔥 True Episodic Pivot — The most important signal
- 🎯 Perfect Setup
- 💪 Strong Buy Signal
- Buy Signal
- Quality Momentum Burst
- Consolidation Breakout
- RS New High
- ⚠️ Bag Holder Warning
- Exit Signal
- Gap Up/Down
----------------------------------------------------------------------------------------------
📚 STOCKBEE METHODOLOGY SUMMARY
Core Principles:
- Buy Day 1 of breakout, not Day 3+ (bag holder territory)
- Focus on $10-$100 stocks with RS > 80
- Prefer breakouts after tight consolidation or negative day
- Close near high of day on breakout confirms strength
- Volume > previous day volume on breakout
- Exit on first down day after 3+ up days
- Hold 2-5 days typically for 8-40% gains
MAGNA Criteria:
- Massive earnings (100%+ EPS/Sales growth)
- Gap up (4%+ on 100k+ pre-market volume)
- Neglected (low prior volume, minimal institutional ownership)
- Analyst upgrades
----------------------------------------------------------------------------------------------
💡 USAGE TIPS
- For best results: Use on daily timeframe with stocks $10-$100
- Focus on: 🔥 EP and ★ (quality) signals
- Avoid: Entries showing "LATE" warning
- Combine with: Fundamental screening (EPS growth 25%+)
- Use trend filter: Prefer stocks above 50-day MA
----------------------------------------------------------------------------------------------
⚠️ DISCLAIMER
This indicator is for educational purposes. Past performance is not indicative of future results. Always use proper risk management and position sizing. Not financial advice.
----------------------------------------------------------------------------------------------
Based on the research and methodology of Pradeep Bonde at Stockbee.com
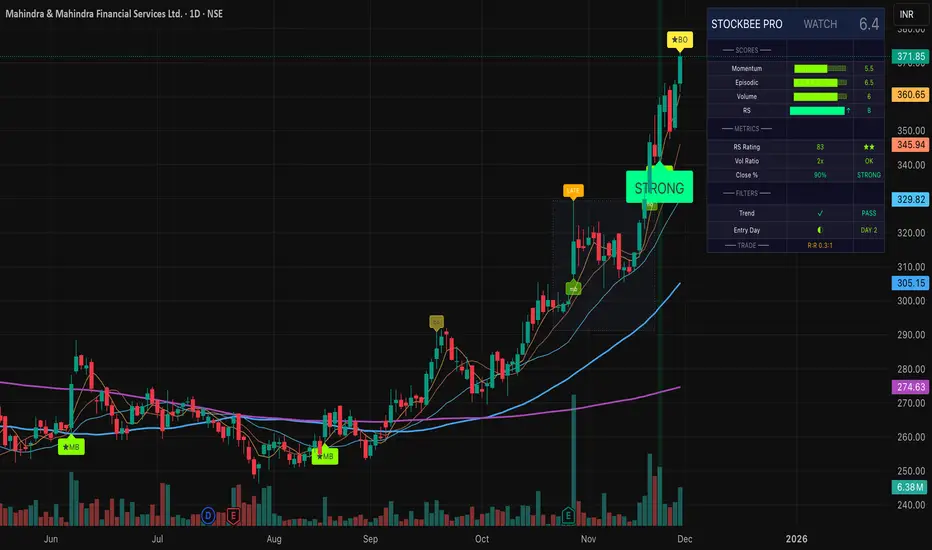
QuantMotions - FVG with Volume TrackingFair Value Gap Detector with Dynamic Shrinking & Volume Analysis
Overview
Advanced Fair Value Gap (FVG) detection indicator with real-time box shrinking and volume delta analysis. Automatically identifies price inefficiencies and tracks institutional volume flow within each gap.
What are Fair Value Gaps?
Fair Value Gaps occur when price moves so rapidly that a "gap" is left between three consecutive candles, creating an inefficiency where no trading occurred. These gaps often act as support/resistance zones that price tends to revisit.
Detection:
- Bullish FVG: When low > high (upward price inefficiency)
- Bearish FVG: When high < low (downward price inefficiency)
Key Features
Dynamic Box Shrinking
FVG boxes automatically shrink as price enters them:
- Bullish FVGs shrink from top as price moves down into the gap
- Bearish FVGs shrink from bottom as price moves up into the gap
- Provides precise visualization of remaining unfilled gap area
Volume Delta Analysis
Tracks volume characteristics for the 3-candle FVG formation:
- Total Volume: Sum of volume from all three FVG candles
- Up/Down Split: Separates buying vs selling pressure
- Delta %: Shows directional bias of volume flow
- Color Coding: Green/Red when volume confirms direction, Orange when it doesn't
Smart Filtering
- ATR-based minimum gap size - Filters out insignificant noise gaps
- Auto-cleanup - Removes fully filled FVGs automatically
- Maximum display limit - Keeps charts clean by limiting visible FVGs
Live Statistics
Real-time stats table showing:
- Active bullish/bearish FVG count
- Average volume delta for each direction
- Fill progress tracking
Settings
Min Gap Size (ATR): Minimum gap size as multiple of ATR(14). Default: 0.3
- Lower values (0.1-0.3): More sensitive, shows smaller gaps
- Higher values (0.5-1.0): More selective, only significant gaps
Max FVGs: Maximum number of FVG boxes to display (5-100)
Remove Fully Filled: Automatically remove FVGs when price completely fills them
Shrink on Partial Fill: Enable dynamic box shrinking as price enters gaps
Show Volume Info: Display volume delta labels at box edges
How to Use
1. Confluence Trading: Look for FVGs that align with your support/resistance levels
2. Volume Confirmation: Check volume delta - strong directional volume increases probability
3. Partial Fills: Watch for price reactions at shrinking FVG boundaries
4. Multiple Timeframes: Use on higher timeframes (4H+) for swing trading, lower timeframes for scalping
Best Practices
- Combine with trend analysis - FVGs in trend direction have higher fill rates
- Pay attention to volume delta - gaps with confirming volume are more reliable
- Use on liquid markets for accurate volume data
- Higher timeframe FVGs typically carry more significance
Notes
- Works on all timeframes and instruments
- Volume data accuracy depends on your data provider
- FVGs are not guaranteed support/resistance - use proper risk management
- This indicator shows historical inefficiencies, not future predictions
Disclaimer: This indicator is for educational purposes only. Past performance does not guarantee future results. Always use proper risk management.

MarketSmith / MarketSurge Style VolumesPurpose
Emulates MarketSmith-style volume analysis in TradingView.
Focused on abnormal volume, institutional footprints, and volume vs. average.
Core Display
Plots a volume histogram with a volume moving average (daily or weekly length).
Optional truncation: caps bars at 2× average volume for cleaner scaling.
Bar colors:
Up/down based on current vs. previous close.
Optional special colour for low relative volume (10-bar lows).
Highest-Volume Logic (HVE / HV1)
Detects:
HVE – Highest Volume Ever.
HV1 – Highest Volume in Over a Year (252D / 52W / 12M).
Labels key peaks with:
“HVE” / “HV1” tags.
Optional shares traded (K/M/B) and % above volume MA.
Uses pivot logic over a configurable Peak Length to anchor volume peaks.
Current Bar Labels
On the latest bar, shows:
Formatted volume (K/M/B).
Volume buzz = % above/below average volume.
Buzz label colored green/red depending on positive or negative reading.
Volume Buzz & Trend Context
volBuzz = 100 * (vol / MA – 1) plotted as a separate series.
Highlights stretches of unusually high or low activity relative to the norm.
Up / Down Volume Ratio
Sums up-volume and down-volume over the last 50 bars.
Computes Up/Down Volume Ratio = sumUp / sumDn to gauge buying vs. selling pressure.
Info Table (Top-Right)
Optional small table showing:
Avg Volume (K/M/B).
Avg Dollar Volume (close × MA).
U/D Volume Ratio.
Optional current volume and current buzz with positive/negative colors.
Overall
Not a signal system—it's a volume-reading assistant.
Helps identify true standout volume, institutional spikes, and quiet vs. aggressive trading conditions at a glance.
